Performance characteristics of the DelftBlue 'gpu' nodes
We focus on the two hardware characteristics that determine performance of typical CS\&E workflows: Memory bandwidth and floating-point performance. More detailed benchmark results for all node types (and including some applications) can be found in this report.
Memory bandwidth
The bandwidth (in GB/s) achieved by different operations (load/store ratios) was measured as
| benchmark | V100s | A100 |
|---|---|---|
| load | 570 | 1560 |
| store | 1120 | 1780 |
| triad | 1010 | 1690 |
| --------- | ----- | ---- |
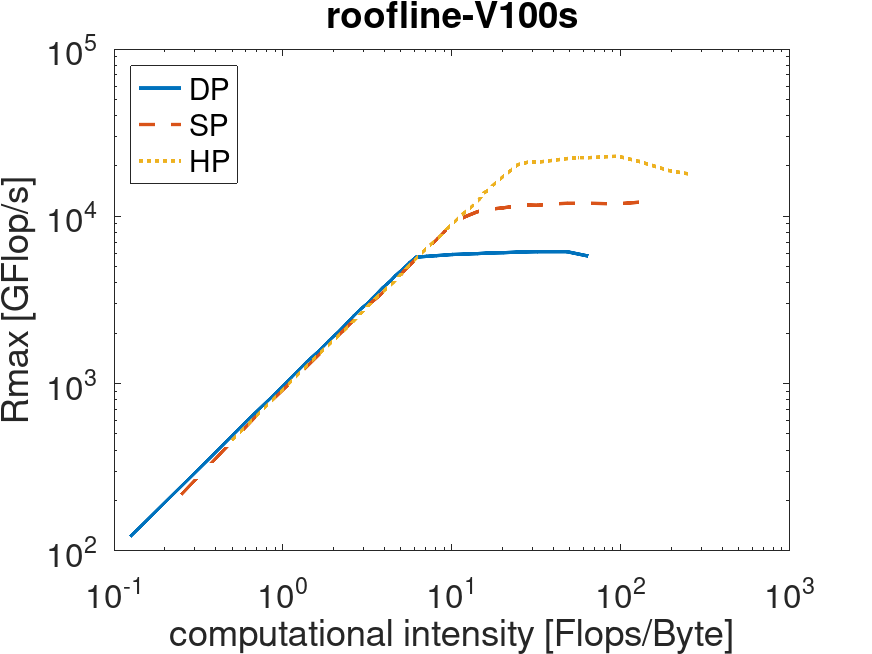
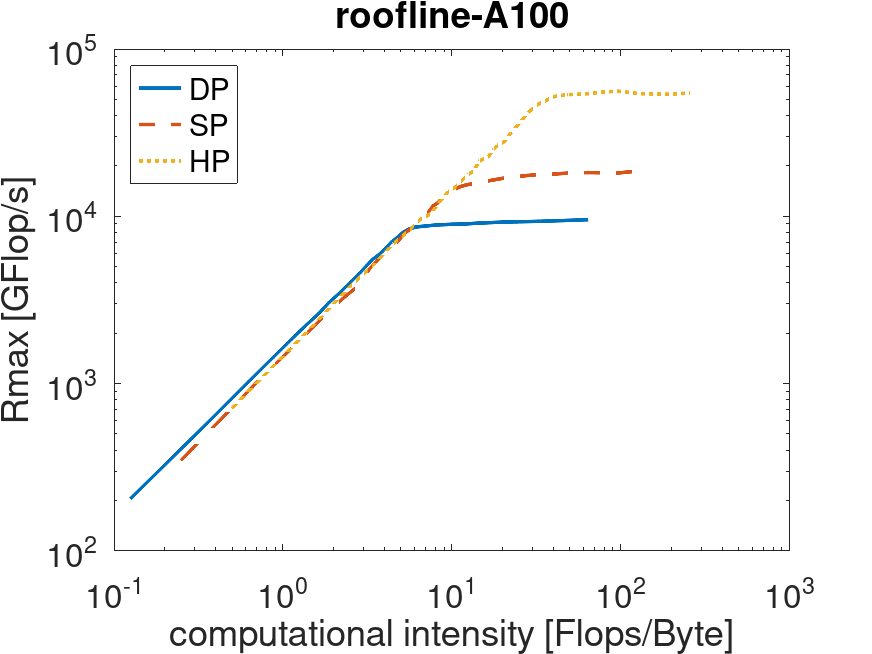
Floating-point performance
Depending on their computational intensity (ratio of computation to data transfers), applications are either memory- or compute-bound. For floating-point operations in double, single and half precision, the achieved performance (in GFlop/s) is shown below.
| V100s (Phase 1) | A100 (Phase 2) |
|---|---|
 |
 |
| ------------------------------------------------------------- | ------------------------------------------------------------ |
Measuring GPU usage of your application
On the GPU nodes, you can use the nvidia-smi command to monitor the GPU usage by your executable. Add the following to your submission scripts:
# Measure GPU usage of your job (initialization)
previous=$(nvidia-smi --query-accounted-apps='gpu_utilization,mem_utilization,max_memory_usage,time' --format='csv' | /usr/bin/tail -n '+2')

# Use this simple command to check that your sbatch settings are working (it should show the GPU that you requested)
nvidia-smi

# Your job commands go below here

# load modules you need...

# Computations should be started with 'srun'. For example:
#srun python my_program.py

# Your job commands go above here

# Measure GPU usage of your job (result)
nvidia-smi --query-accounted-apps='gpu_utilization,mem_utilization,max_memory_usage,time' --format='csv' | /usr/bin/grep -v -F "$previous"